JobsListAI Research
Which Industries Will AI Replace First? Who Is Most at Risk?
JobsListAI
Executive summary
Executive summary
The headline answer. AI is not replacing whole industries; it is replacing specific tasks, and the jobs built mostly from them. Finance & insurance, information, and professional services are the most exposed industries. The jobs closest to actual replacement, though, are customer service, general clerical and administrative support roles that sit inside every industry. About 12.1 million US workers (8.4% of the employment we scored) hold jobs that are both in the top fifth for AI exposure and projected by BLS to shrink by 2035. Those workers earn about half as much as workers in highly exposed jobs that are still growing, and about 72% of them are women.
Key findings
- Exposure is concentrated in white-collar industries. On our composite AI Exposure Index (0-100, built from four published measures), finance & insurance scores 78, information 73, management of companies 72 and professional, scientific & technical services 72. Agriculture (24), transportation & warehousing (35), mining (35), construction (35) and accommodation & food services (36) score lowest. (Exhibit 2)
- Exposure is not the same as replacement. Among the 114 most exposed occupations (28.9M workers), BLS projects 43 to grow faster than average (the "augmentation zone": software developers, accountants, analysts, data scientists) and 39 to shrink (the "substitution zone": customer service reps, office clerks, secretaries, data entry keyers, computer programmers). (Exhibits 3-5)
- Replacement risk falls on lower-paid, non-degree workers, mostly women. Substitution-zone jobs pay a wage-weighted average median of about $52,000, versus about $98,000 in the augmentation zone. Women hold about 72% of substitution-zone jobs, versus 48% across all matched occupations. 84% of substitution-zone workers are in jobs that typically require only a high school diploma. (Exhibit 6)
- The shift is already visible, but as slower growth, not mass layoffs. From May 2021 to May 2025, employment in the most exposed fifth of jobs grew 5.7%, half the 11.3% growth of all other jobs. Office & administrative support shrank 3.2%. Since ChatGPT launched (Nov 2022), payrolls in the information sector fell 12.2%, and every high-exposure sector trailed the 3.1% private-sector growth rate. (Exhibits 7-8)
- Entry-level workers are the early warning. Stanford researchers using ADP payroll data find employment of 22-25-year-olds in AI-exposed occupations is now 19% below where it would be had it tracked less-exposed peers, while experienced workers show no gap. Economy-wide displacement has not appeared: Yale's Budget Lab and Anthropic find no clear rise in unemployment among exposed workers. (Exhibit 10)
Exhibit 1
Key figures
| Metric | Value | Source |
|---|---|---|
| US jobs scored | 144.0M of 155.5M (772 occupations) | BLS OEWS May 2025 + exposure measures |
| Workers in the top AI-exposure quintile | 28.9M (114 occupations) | JobsListAI analysis |
| Workers in the "substitution zone" (top-quintile exposure + BLS-projected decline) | 12.1M (39 occupations) | JobsListAI analysis of BLS EP 2025-35 |
| Workers in the "augmentation zone" (top-quintile exposure + above-average projected growth) | 11.2M (43 occupations) | JobsListAI analysis |
| Occupations where BLS explicitly cites AI in its 2025-35 projections | 48 (42 scored here, 16.9M workers) | BLS EP Table 1.12 |
| US businesses using AI (two-week reference period) | 24.2% (Oct 5-18, 2026), up from 17.7% (Dec 15-28, 2025) | Census BTOS |
Exhibit 2
AI-exposure ranking of US industries
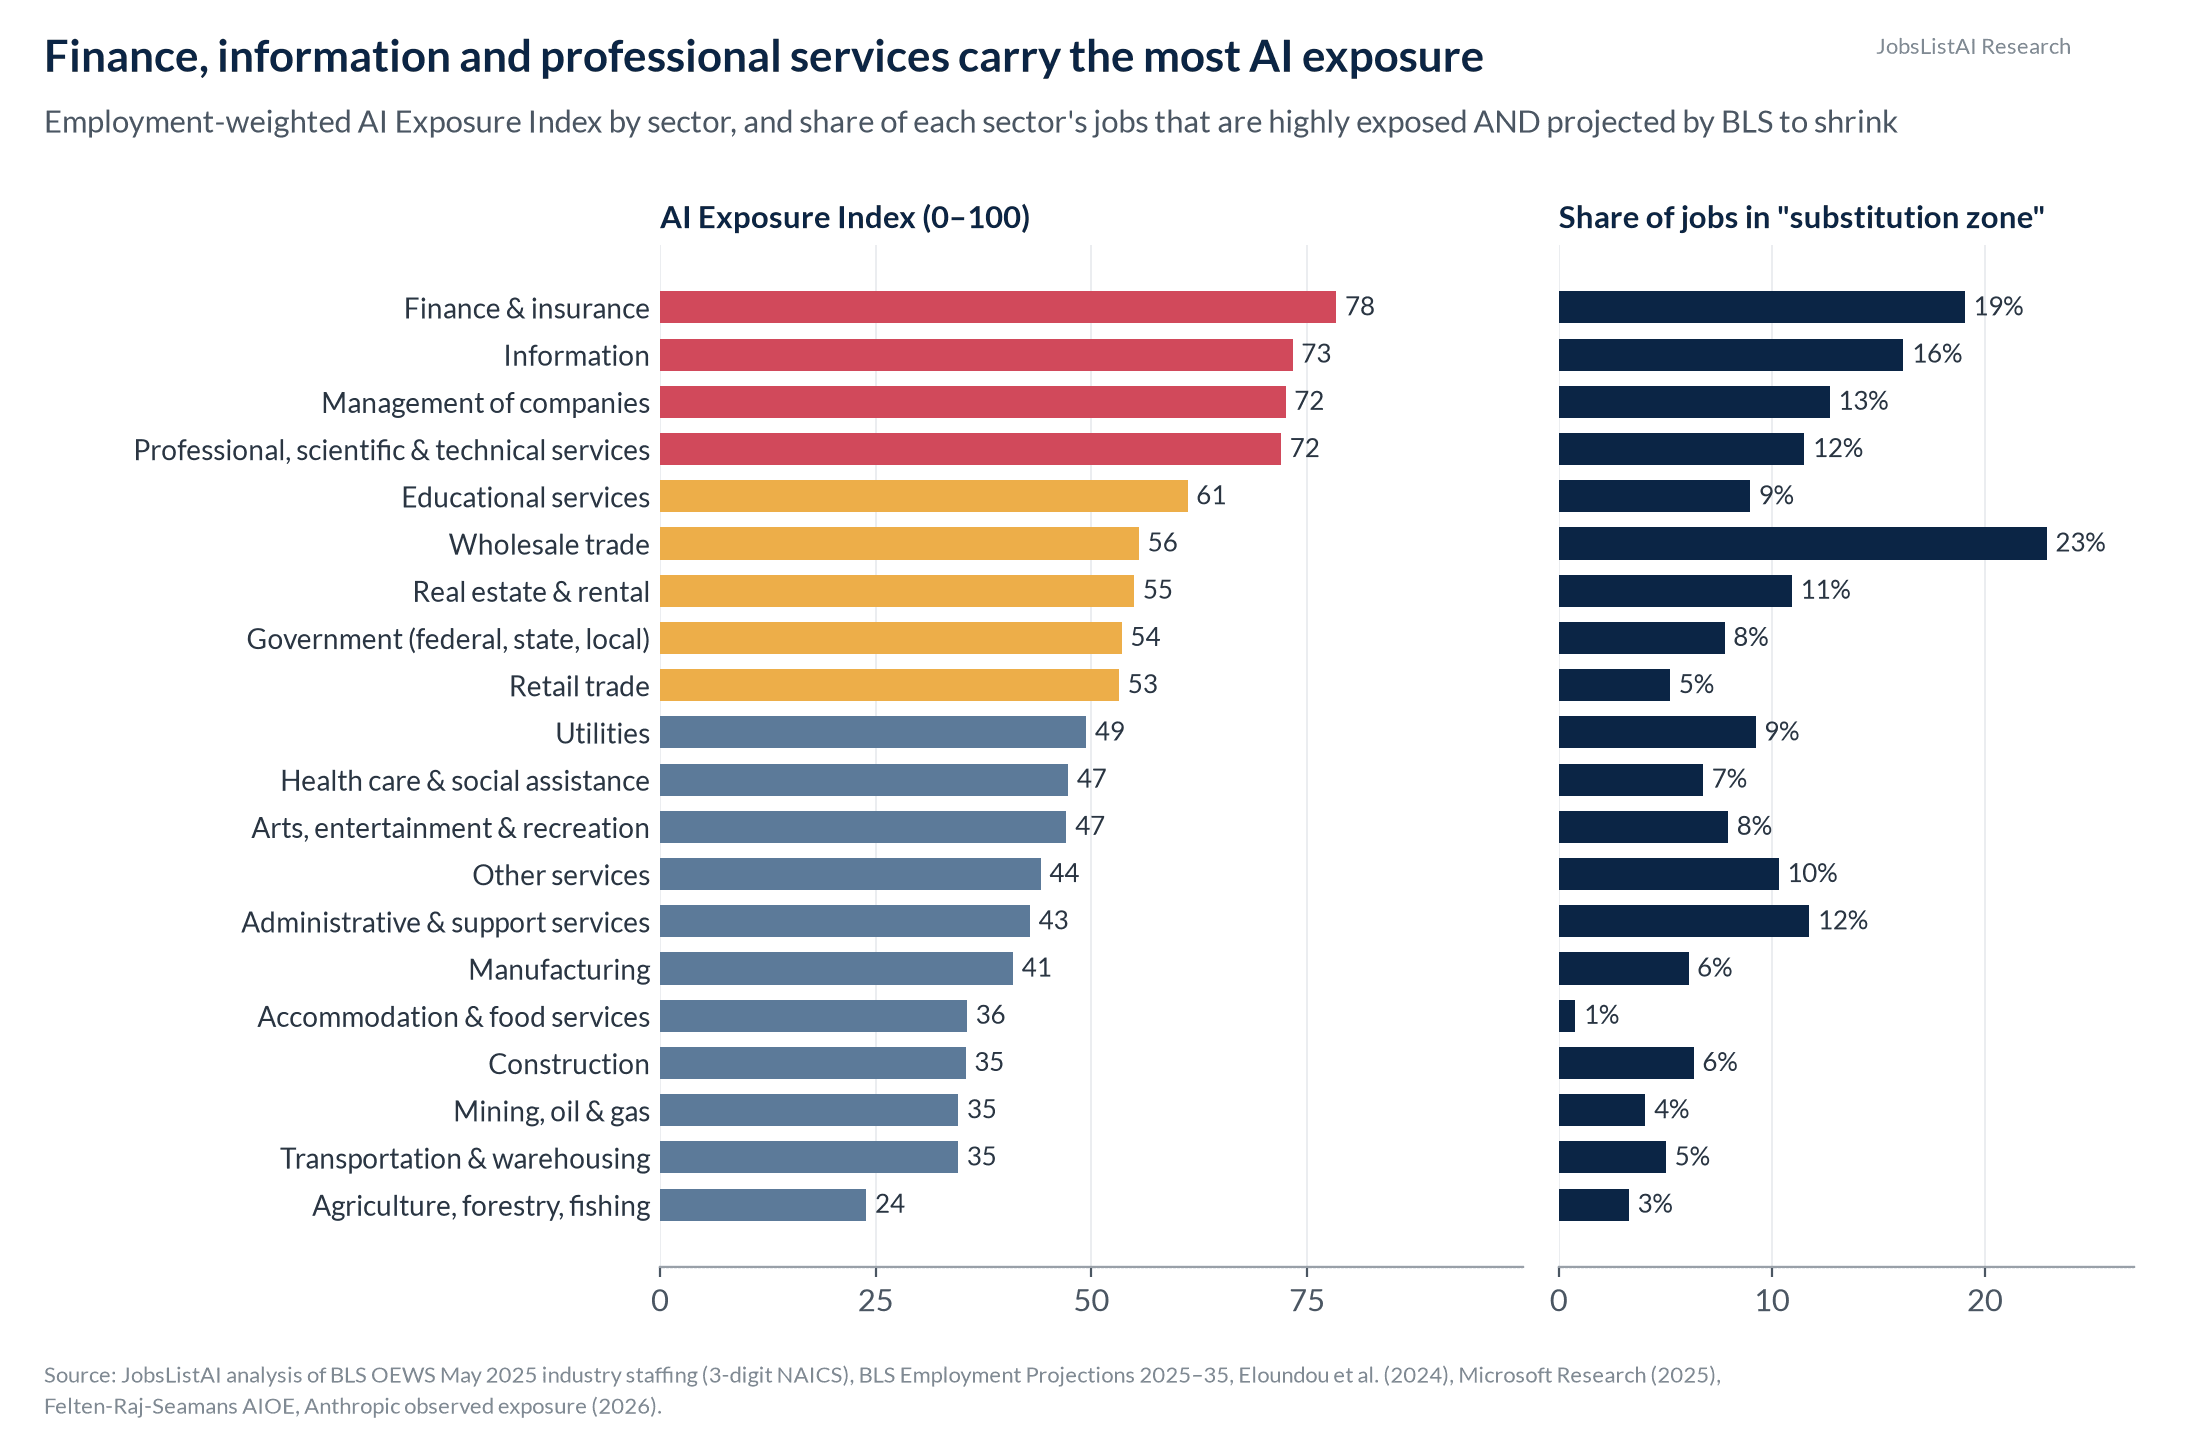
| Rank | Sector | AI Exposure Index | Jobs in top exposure quintile | Jobs in substitution zone | Payroll change Nov 2022-Oct 2026 | Firms using AI (Oct 2026) |
|---|---|---|---|---|---|---|
| 1 | Finance & insurance | 78 | 62% | 19% | -1.1% | 39.2% |
| 2 | Information | 73 | 57% | 16% | -12.2% | 45.0% |
| 3 | Management of companies | 72 | 47% | 13% | +1.9% | n/a |
| 4 | Professional, scientific & technical services | 72 | 45% | 12% | +2.1% | 41.6% |
| 5 | Educational services | 61 | 20% | 9% | +6.7% | 39.5% |
| 6 | Wholesale trade | 56 | 35% | 23% | +0.3% | 23.1% |
| 7 | Real estate & rental | 55 | 27% | 11% | +0.8% | 28.2% |
| 8 | Government | 54 | 21% | 8% | +4.3% | n/a |
| 9 | Retail trade | 53 | 8% | 5% | -0.2% | 19.1% |
| 10 | Utilities | 49 | 19% | 9% | +7.8% | 27.5% |
| 11 | Health care & social assistance | 47 | 16% | 7% | +14.7% | 24.6% |
| 12 | Arts, entertainment & recreation | 47 | 13% | 8% | +11.9% | 22.0% |
| 13 | Other services | 44 | 18% | 10% | +4.9% | 15.7% |
| 14 | Administrative & support services | 43 | 22% | 12% | -4.8% | 22.2% |
| 15 | Manufacturing | 41 | 12% | 6% | -1.7% | 21.4% |
| 16 | Accommodation & food services | 36 | 2% | 1% | +3.6% | 12.1% |
| 17 | Construction | 35 | 10% | 6% | +6.4% | 17.1% |
| 18 | Mining, oil & gas | 35 | 9% | 4% | -3.0% | 10.2% |
| 19 | Transportation & warehousing | 35 | 8% | 5% | +0.3% | 12.6% |
| 20 | Agriculture, forestry, fishing | 24 | 4% | 3% | n/a | n/a |
Source: JobsListAI analysis of BLS OEWS May 2025 industry staffing patterns (3-digit NAICS), BLS Employment Projections 2025-35, BLS CES (seasonally adjusted; Oct 2026 preliminary), Census BTOS (reference period Oct 5-18, 2026). Exposure measures: Eloundou et al.; Microsoft Research; Felten, Raj & Seamans; Anthropic.
At the sub-industry level, the most exposed industries are securities & investments (index 82; 76% of jobs in the top exposure quintile), computing infrastructure & data processing (80), publishing including software (79), insurance carriers (78) and banking/credit intermediation (77).
Exhibit 3
Exposure vs. projected growth, 772 occupations
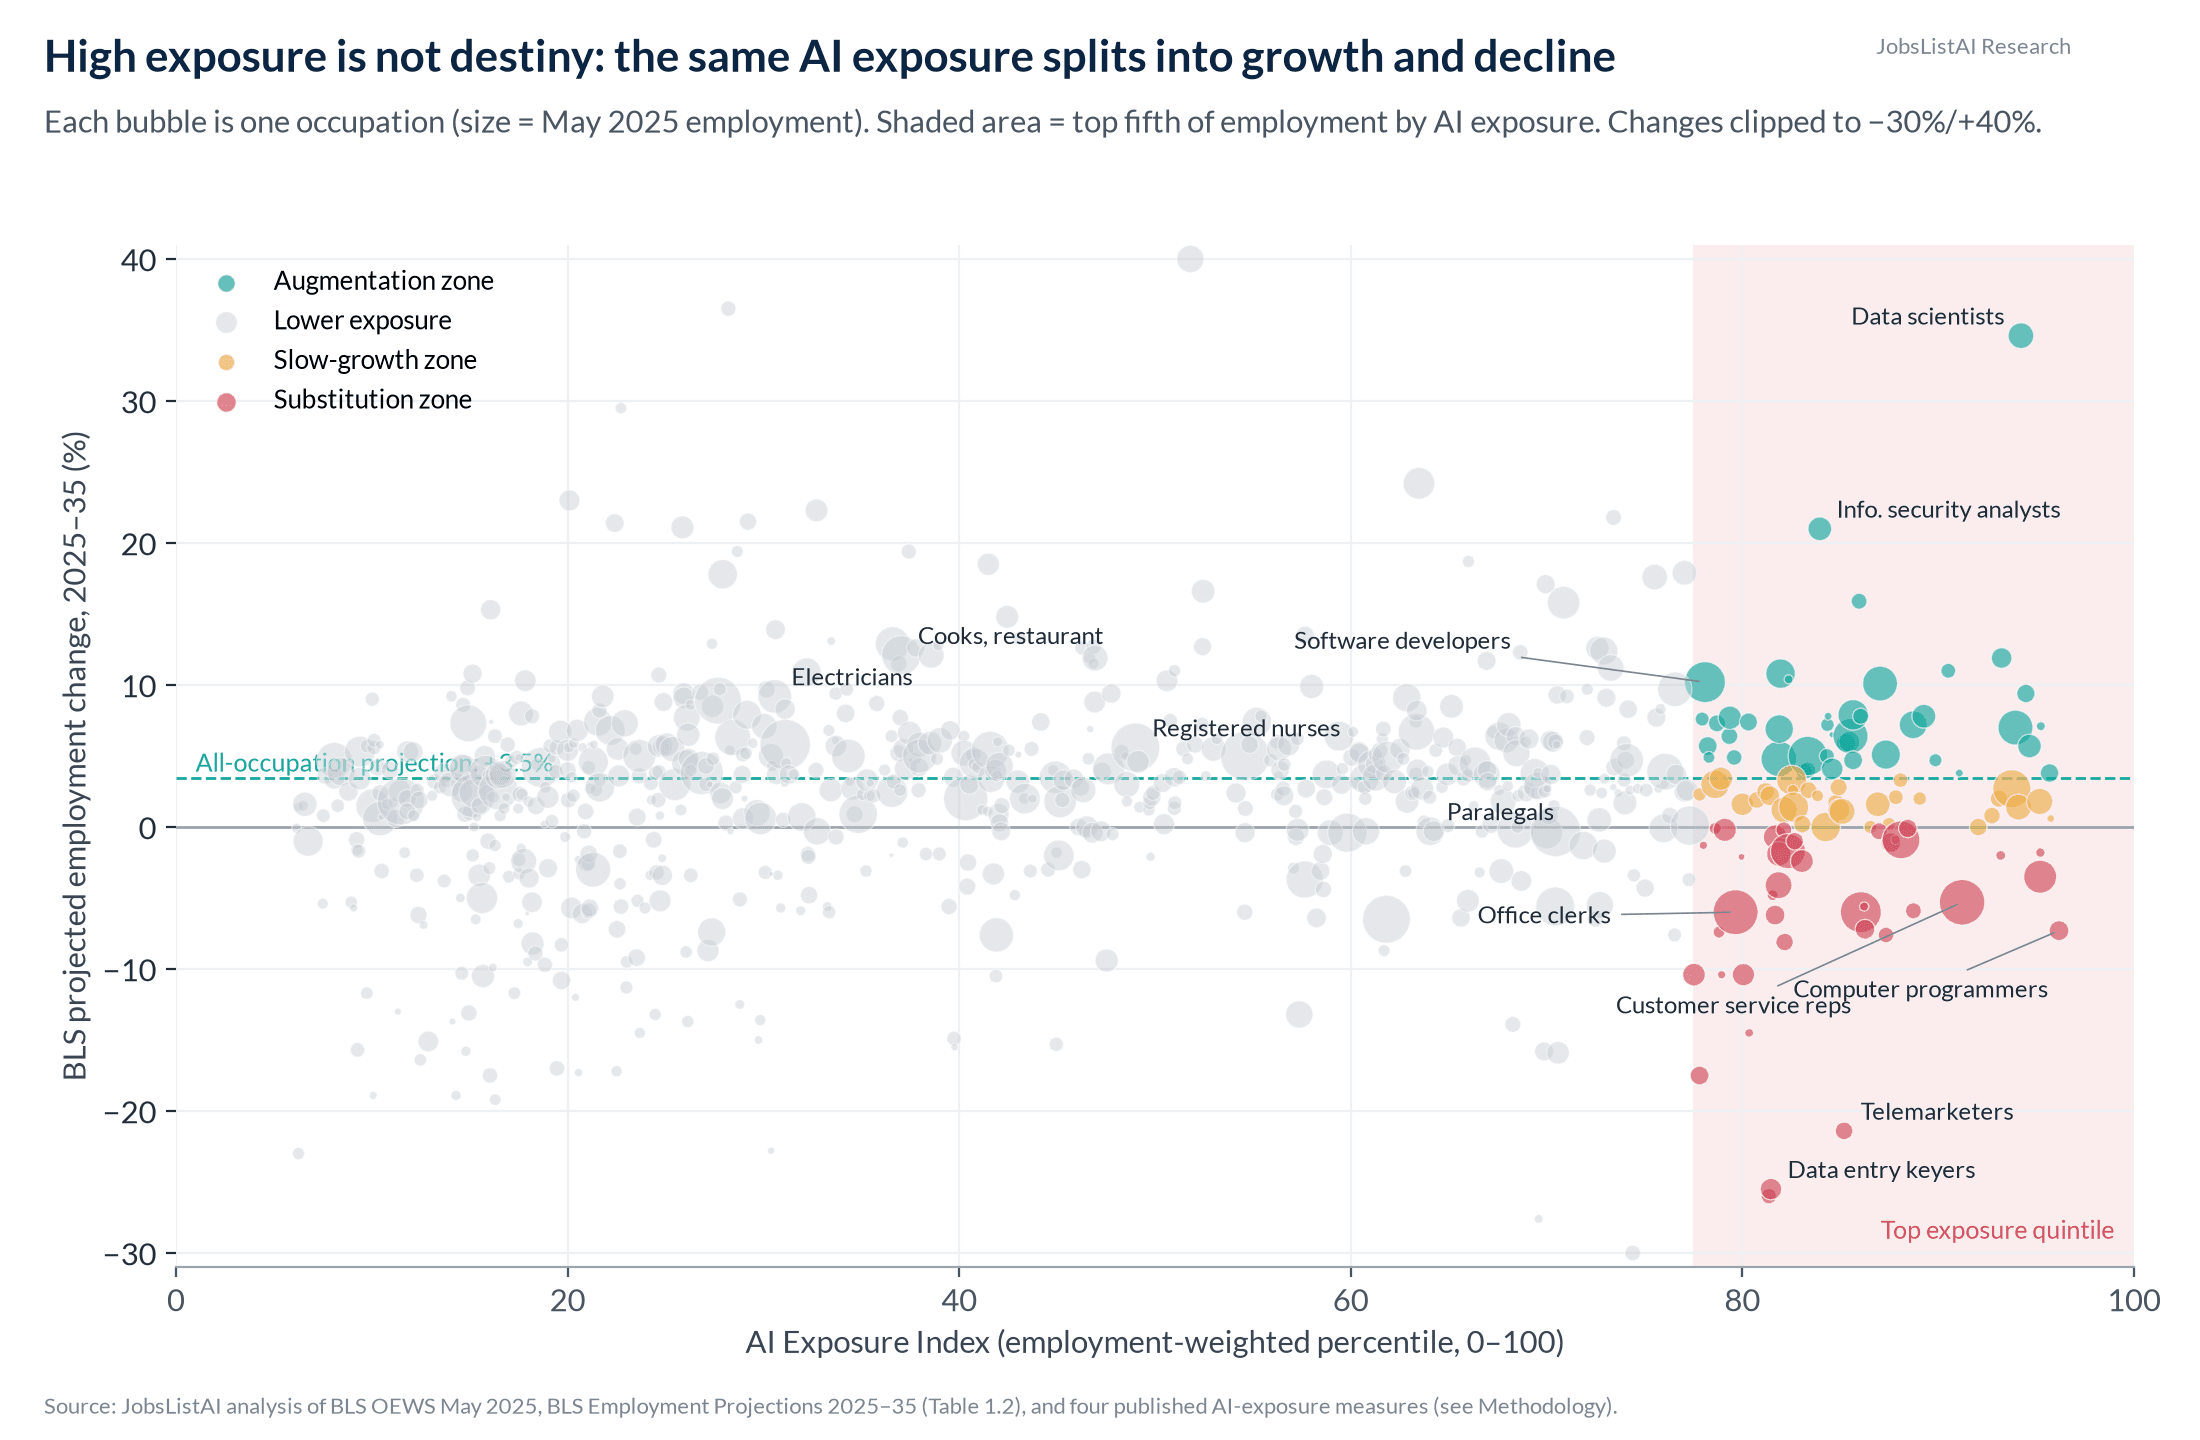
Source: JobsListAI analysis of BLS OEWS May 2025, BLS Employment Projections 2025-35 (Table 1.2), and four published AI-exposure measures (see Methodology).
Exhibit 4
Most at risk (substitution zone, largest occupations)
| Occupation | Employment (May 2025) | Median wage | Exposure index | BLS projected change 2025-35 | Why |
|---|---|---|---|---|---|
| Customer service representatives | 2.60M | $44,770 | 91 | -5.3% | BLS: AI and speech tools handle more interactions (capital/labor substitution) |
| Office clerks, general | 2.46M | $45,010 | 80 | -6.0% | BLS: AI and e-filing automate clerical functions |
| Secretaries & admin assistants | 1.71M | $47,540 | 86 | -6.0% | BLS: AI assists document prep, scheduling, notetaking |
| Wholesale & manufacturing sales reps (non-technical) | 1.24M | $72,080 | 88 | -0.9% | BLS: generative AI integrated into sales process |
| Receptionists & information clerks | 910k | $38,010 | 82 | -1.7% | BLS: AI software automates data collection and documents |
| Computer user support specialists | 717k | $61,860 | 95 | -3.5% | BLS: offshoring plus generative-AI troubleshooting |
| Network & computer systems administrators | 314k | $99,130 | 82 | -4.1% | BLS: duties shift to DevOps and automation |
| Insurance claims & policy processing clerks | 214k | $49,230 | 82 | -1.9% | BLS: AI-enhanced software automates processing |
| Bill & account collectors | 159k | $47,030 | 78 | -10.4% | High exposure + steep projected decline |
| Data entry keyers | 127k | $41,340 | 81 | -25.5% | BLS: replaced by automated processes |
| Computer programmers | 92k | $100,390 | 96 | -7.3% | BLS: work shifts to developers and AI; Anthropic's most-covered job (75%) |
Source: BLS OEWS May 2025; BLS Employment Projections 2025-35 (Tables 1.2 and 1.12, quoted mechanisms); JobsListAI exposure index.
Exhibit 5
Least at risk, and exposed-but-growing
Least exposed large occupations (index under 20, 500k+ workers): landscaping & groundskeeping (8), dining room attendants (9), industrial truck operators (10), maids & housekeepers (10), hand laborers & freight movers (11; 2.95M workers), construction laborers (15), janitors (15), carpenters (16), nursing assistants (16), general maintenance & repair workers (19). Shared trait: physical, in-person, unpredictable environments. Anthropic finds 30% of workers have zero observed AI coverage (cooks, mechanics, lifeguards, bartenders). Caveat: robotics is a separate, slower risk not captured by LLM exposure.
Exposed but growing (augmentation zone): software developers (1.69M; +10.2%), accountants & auditors (1.45M; +5.0%), HR specialists (+6.4%), market research analysts (+7.0%), management analysts (+10.1%), computer systems analysts (+7.9%), financial analysts (+7.2%), data scientists (+34.6%). These jobs are highly exposed, but BLS expects demand to keep rising.
Exhibit 6
Who is at risk
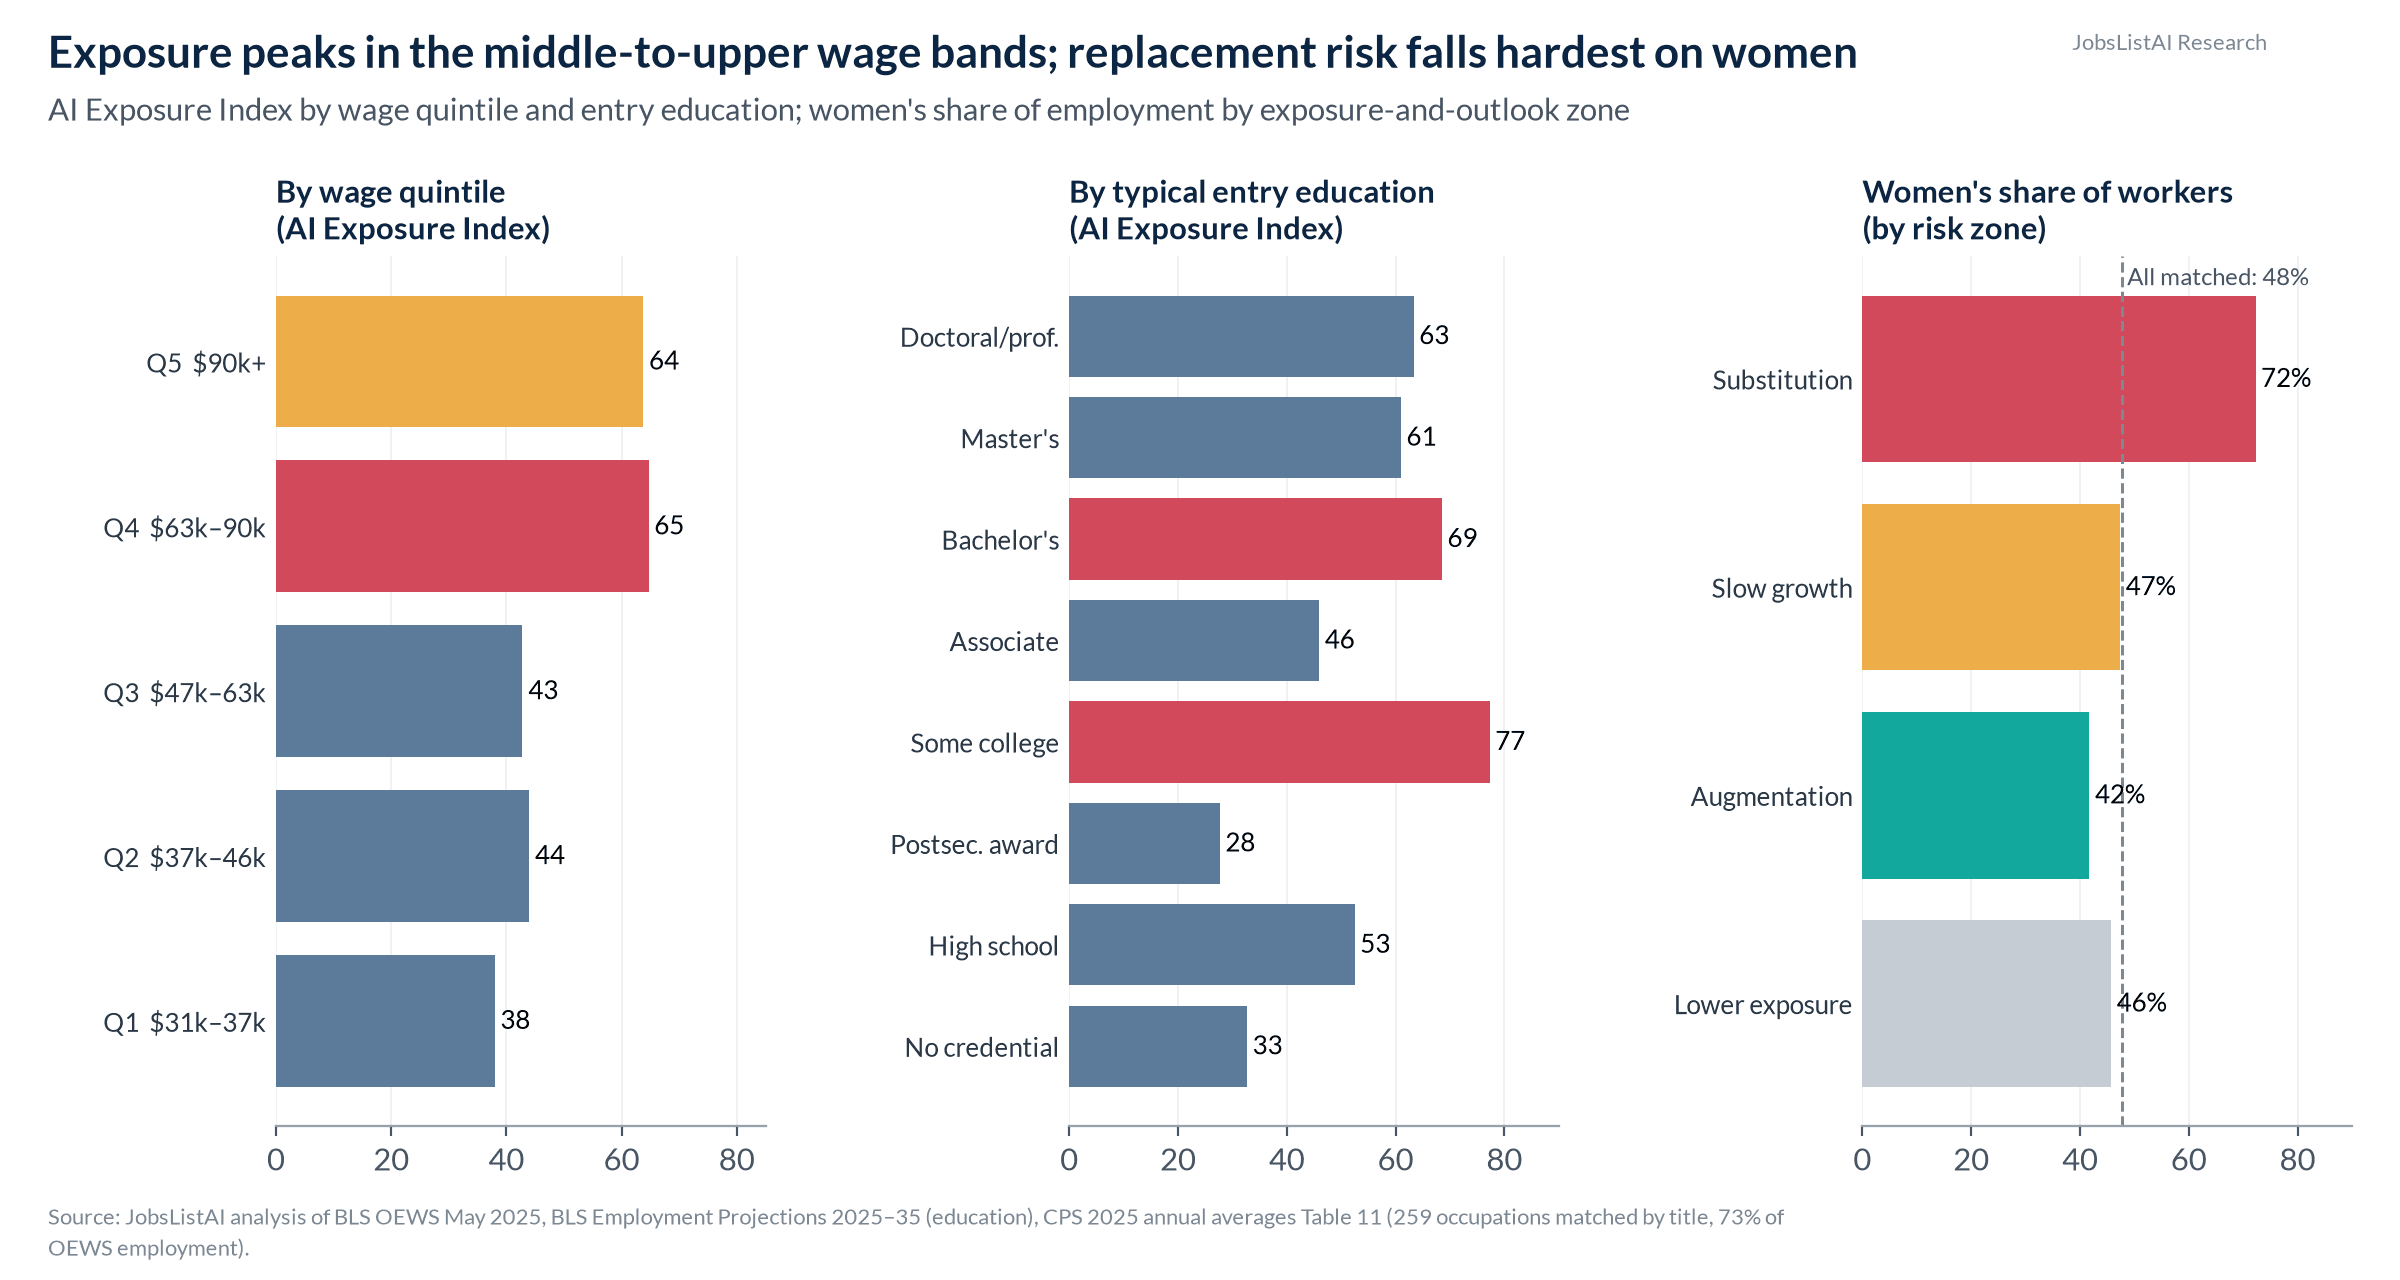
Source: JobsListAI analysis of BLS OEWS May 2025, BLS Employment Projections 2025-35 (education), CPS 2025 annual averages Table 11 (259 occupations matched by title, 73% of OEWS employment).
- Wages: exposure peaks in the 4th wage quintile ($63k-$90k; index 65) and top quintile (64); the lowest-paid fifth scores 38. But replacement risk (substitution zone) concentrates in lower-middle wages (about $52k average).
- Education: jobs typically requiring "some college, no degree" (77) or a bachelor's (69) are most exposed; postsecondary non-degree awards (28) and no formal credential (33) least.
- Gender: women are 72% of substitution-zone workers vs 42% in the augmentation zone (CPS 2025, 259 occupations matched). The ILO finds the same pattern globally: in high-income countries 9.6% of women's jobs are in the highest-exposure gradient vs 3.5% of men's.
- Age: 22-25-year-olds in exposed jobs are 19% below trend (Stanford/ADP); Anthropic finds a 14% drop in job-finding rates for 22-25-year-olds entering exposed occupations (barely significant).
Exhibit 7
What is already happening, by exposure quintile
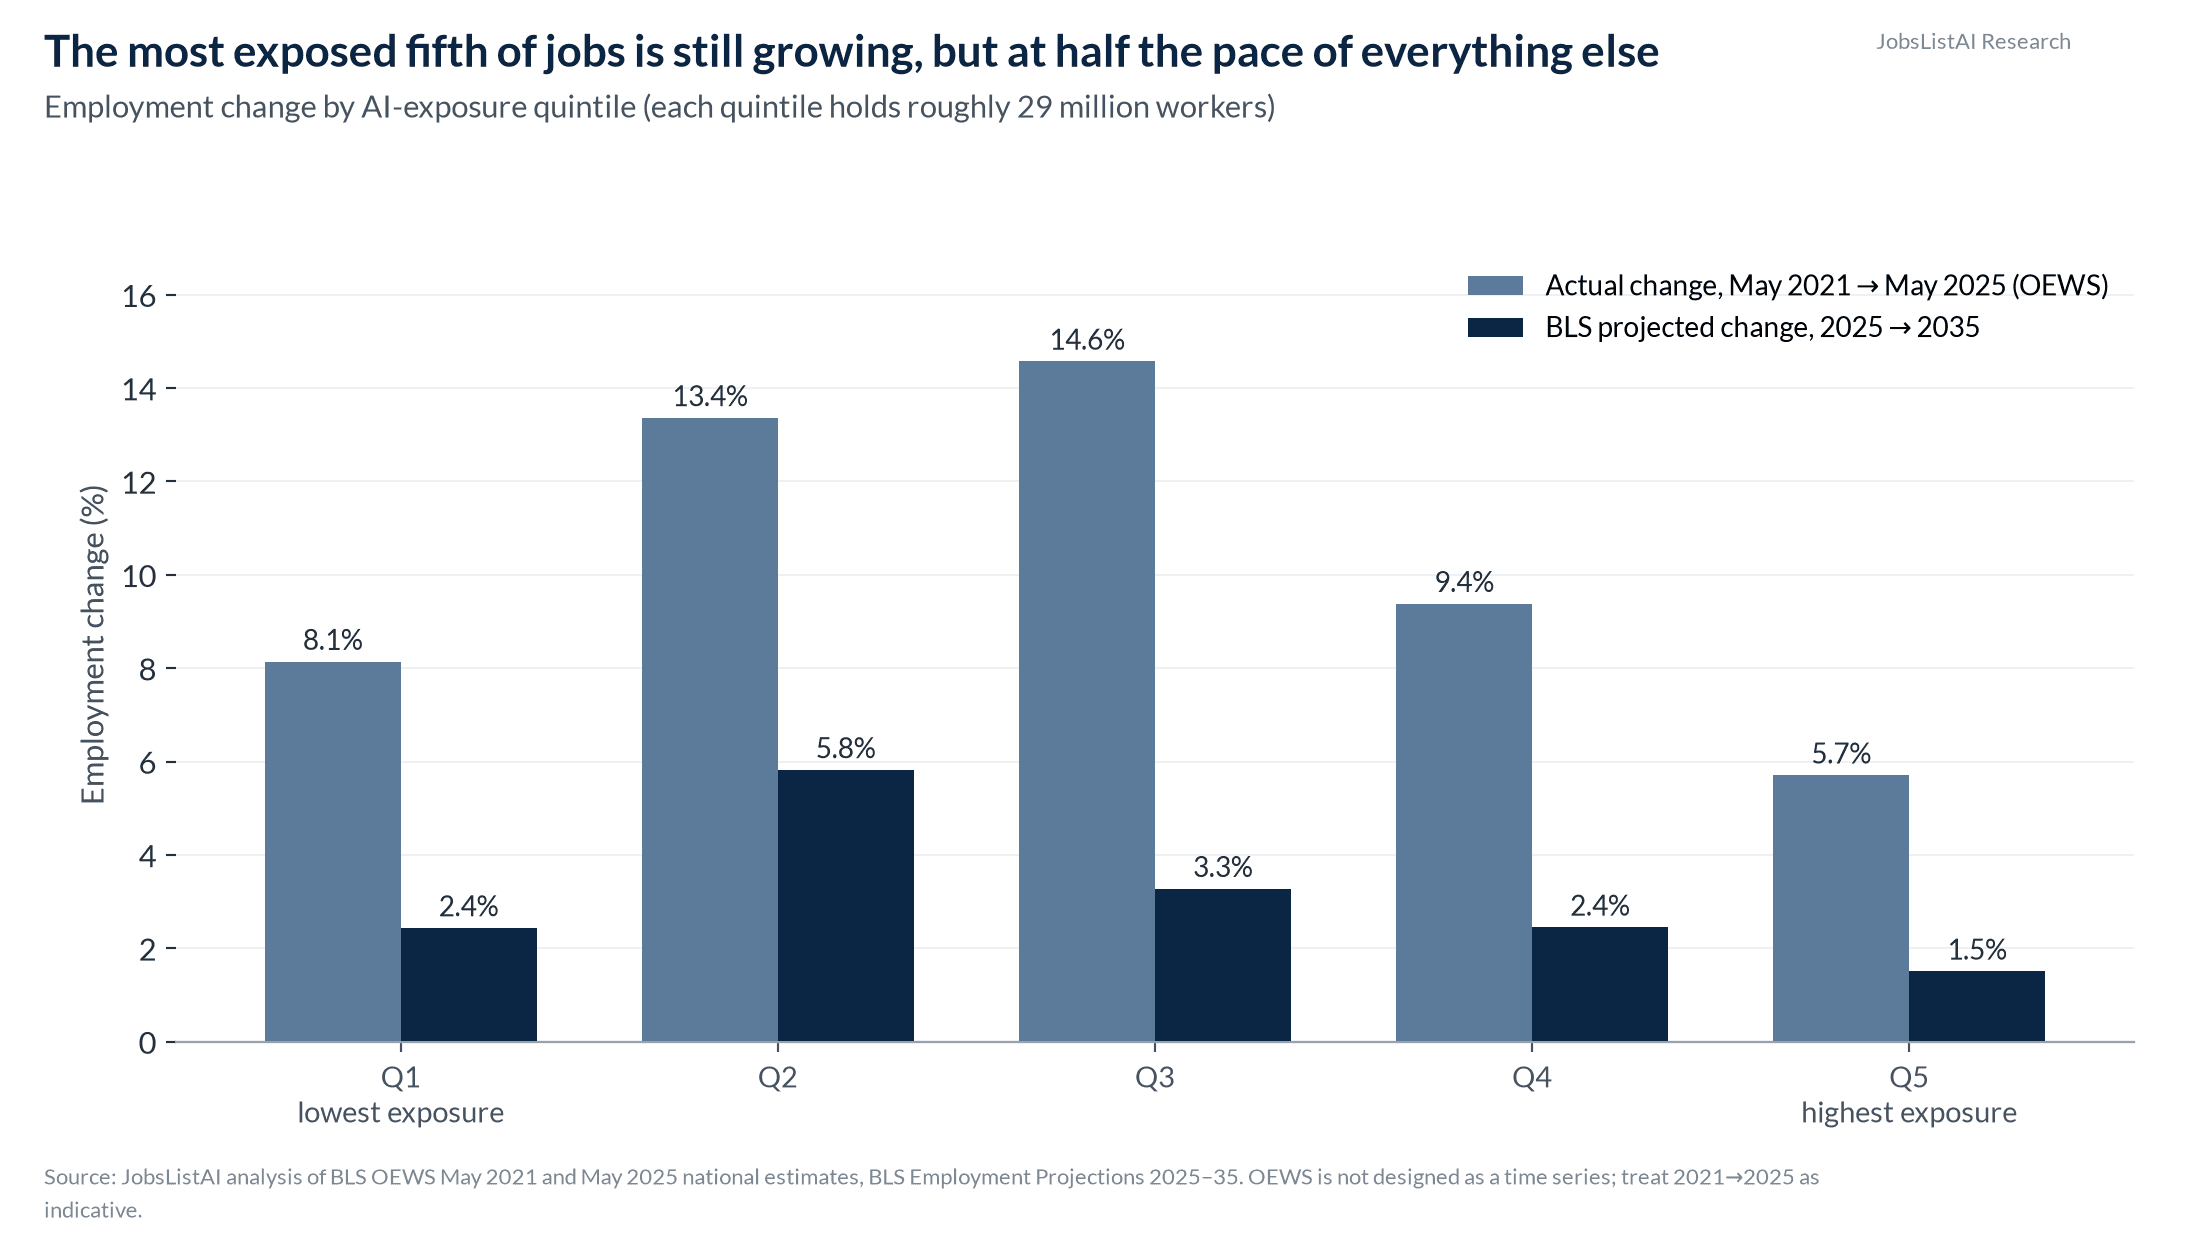
| Exposure quintile | Workers | Actual change May 2021-May 2025 | BLS projected 2025-35 |
|---|---|---|---|
| Q1 (lowest) | 28.7M | +8.1% | +2.4% |
| Q2 | 27.8M | +13.4% | +5.8% |
| Q3 | 29.4M | +14.6% | +3.3% |
| Q4 | 29.3M | +9.4% | +2.4% |
| Q5 (highest) | 28.9M | +5.7% | +1.5% |
Across occupations, a 10-point higher exposure index is associated with a 0.28-point lower BLS projected growth rate (employment-weighted); the relationship is real but weak (weighted correlation -0.12; -0.22 using Anthropic's usage-based measure alone, consistent with Anthropic's own finding).
Source: JobsListAI analysis of BLS OEWS May 2021 and May 2025 national estimates, BLS Employment Projections 2025-35. OEWS is not designed as a time series; treat 2021→2025 as indicative.
Exhibit 8
Sector payrolls since ChatGPT vs. exposure
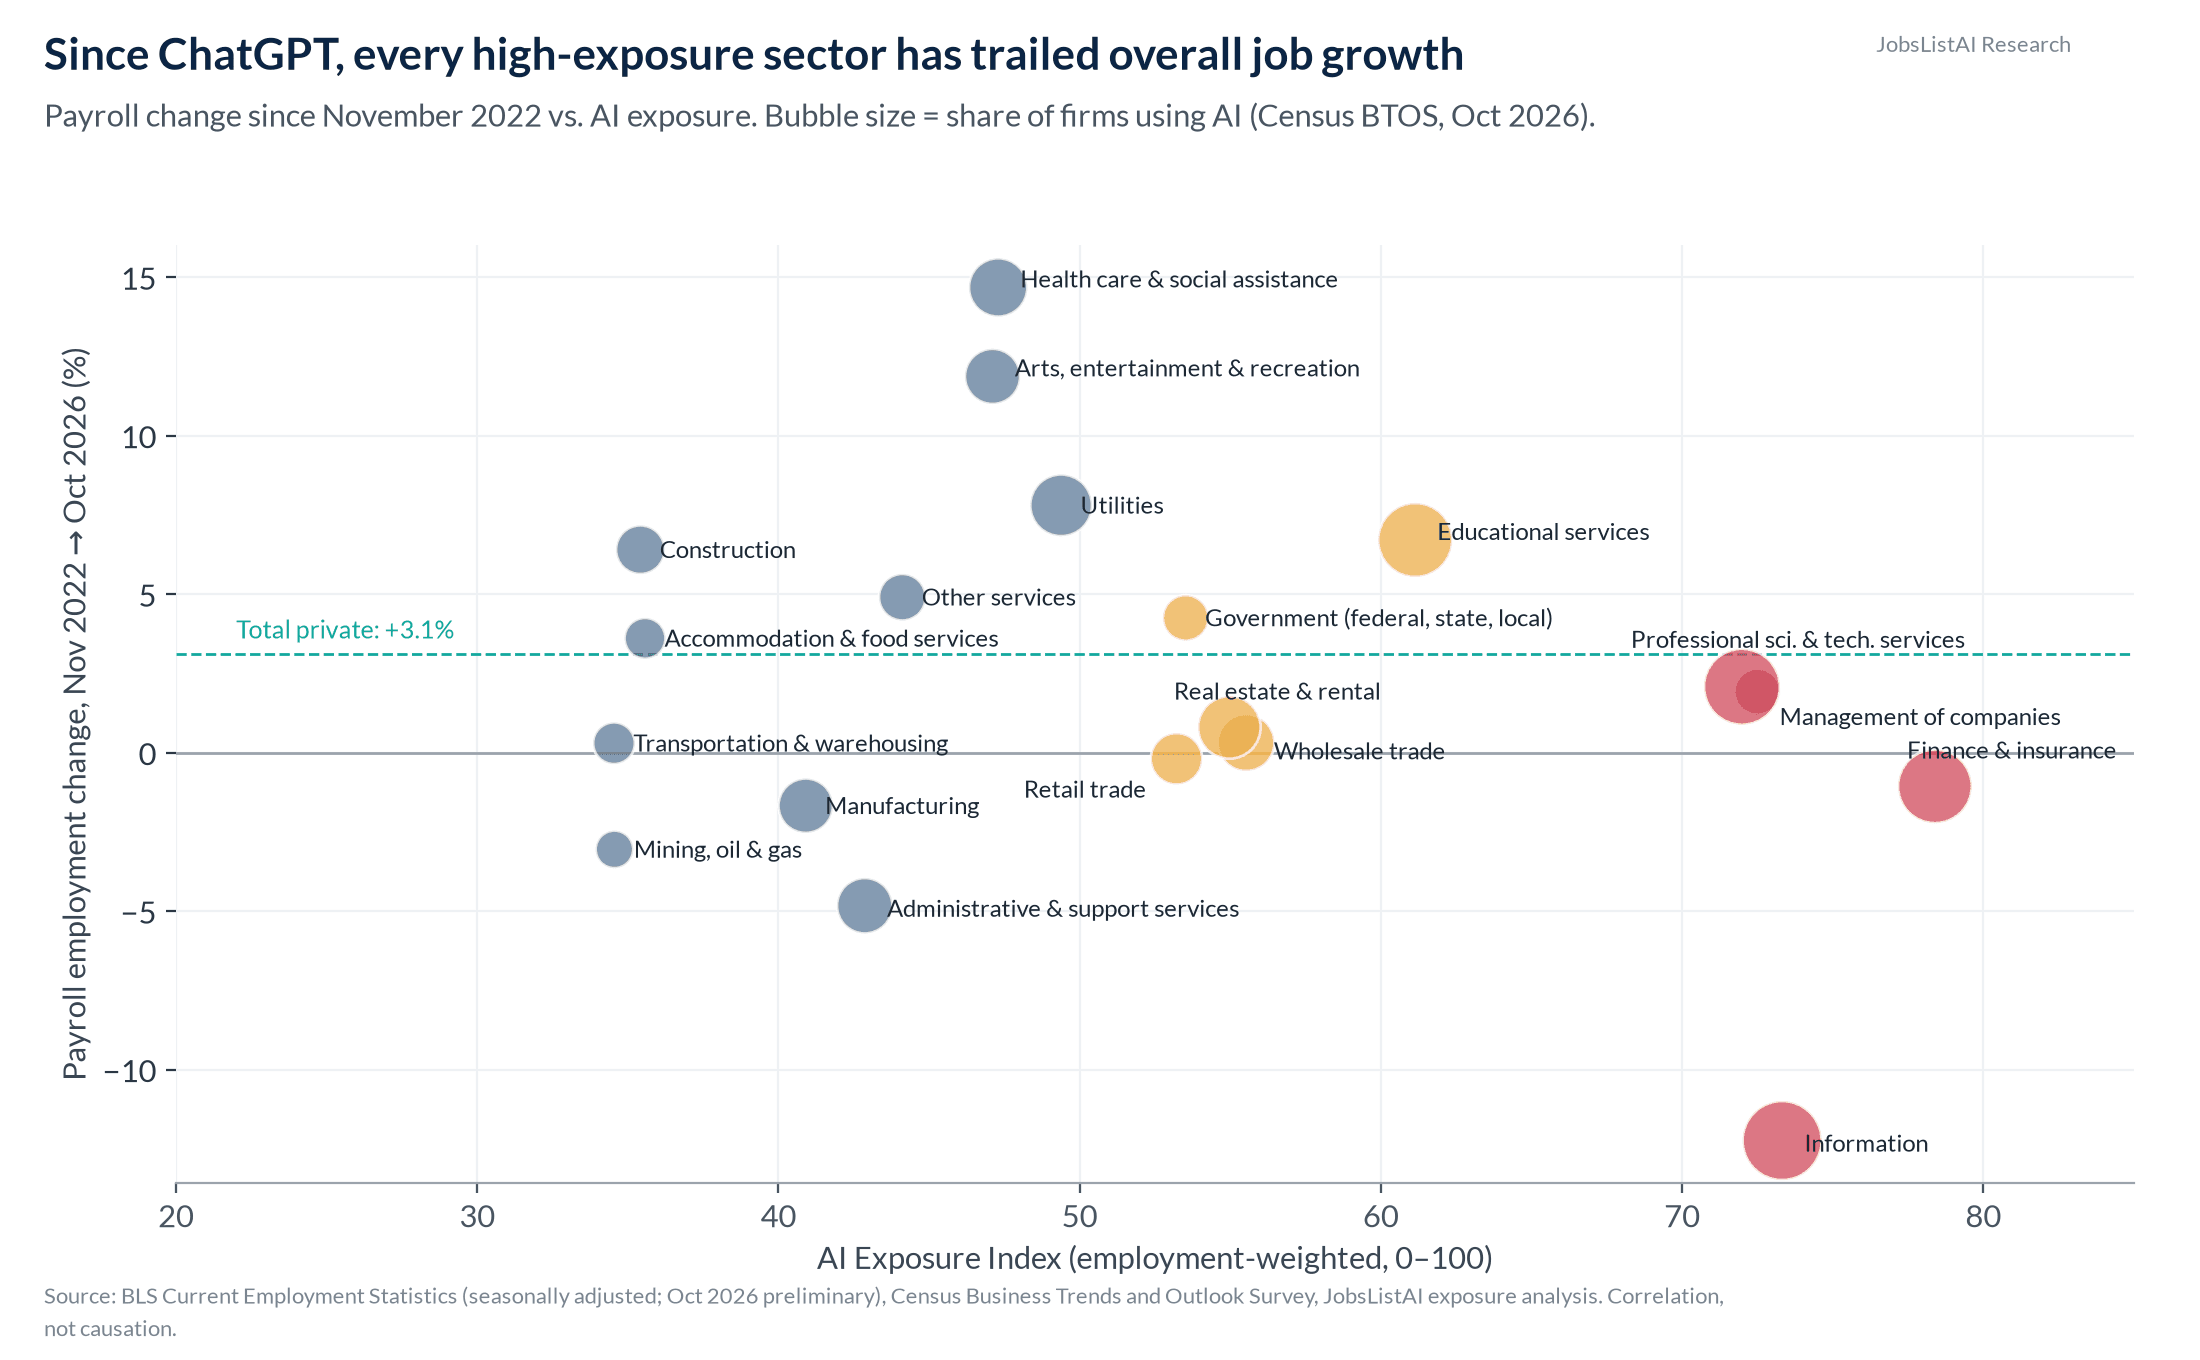
Source: BLS Current Employment Statistics (seasonally adjusted; Oct 2026 preliminary), Census Business Trends and Outlook Survey, JobsListAI exposure analysis. Correlation, not causation.
Information is the one sector where more businesses say AI cut headcount over the past six months (7.9%) than raised it (4.4%), and 9.6% say AI reduced hiring (Census BTOS, Oct 2026). Nationally, 2.5% of businesses report AI reduced headcount and 6.6% report it increased headcount. Caveat: the information sector's decline also reflects the post-2022 tech correction and media consolidation; this is correlation, not proof of AI causation.
Exhibit 9
The gap between what AI could do and what it does
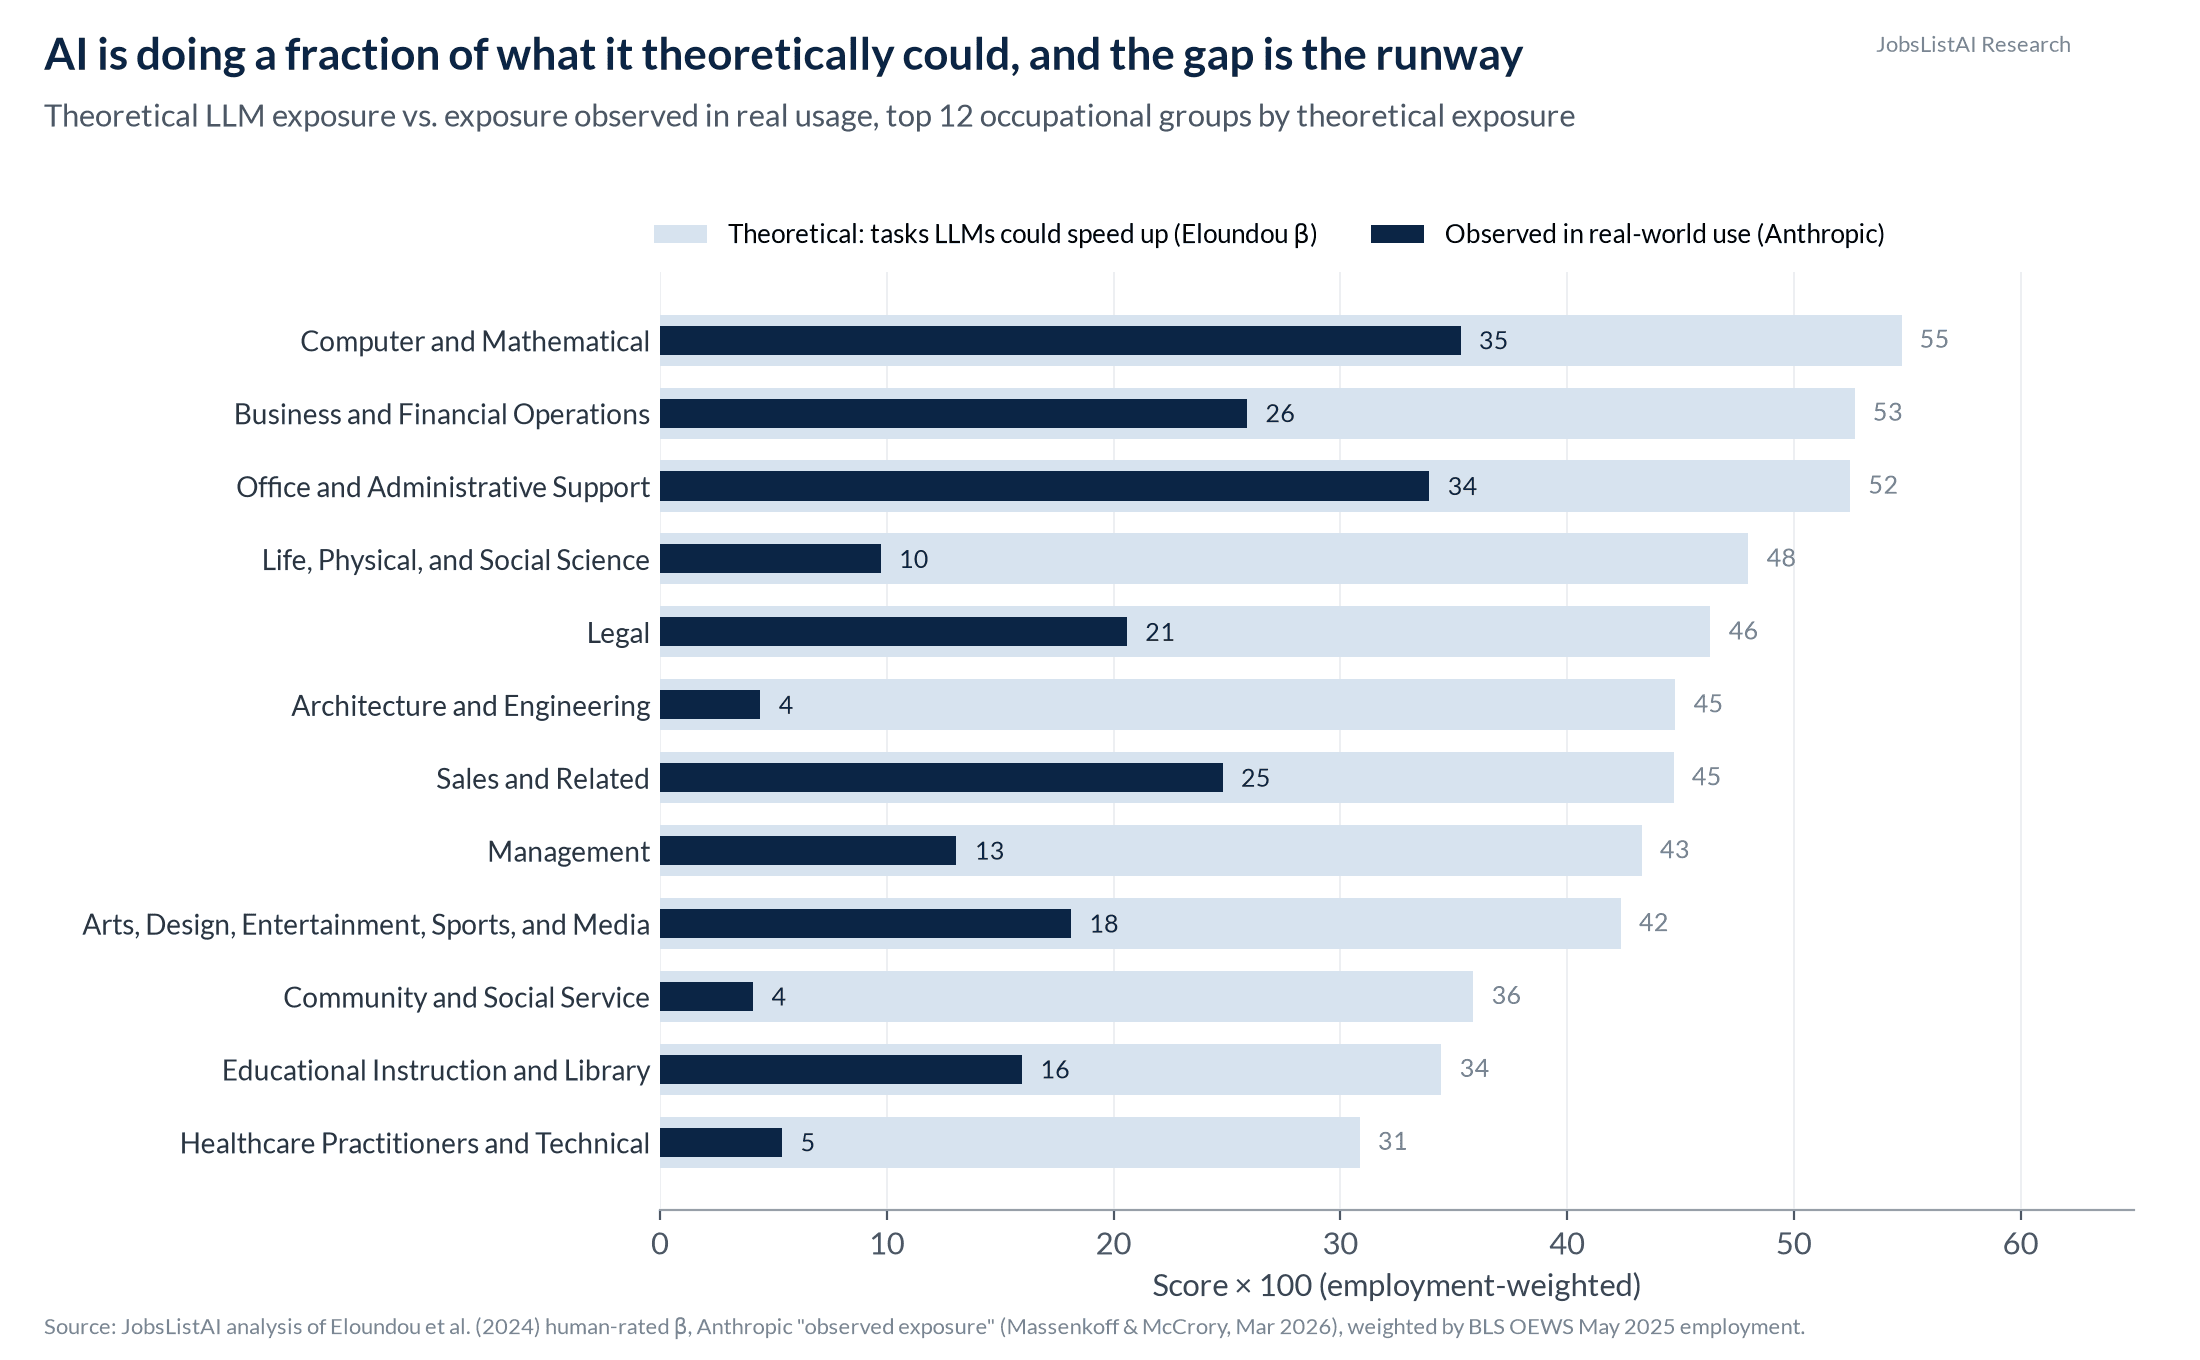
Source: JobsListAI analysis of Eloundou et al. (2024) human-rated β, Anthropic "observed exposure" (Massenkoff & McCrory, Mar 2026), weighted by BLS OEWS May 2025 employment.
Exhibit 10
What the research says (and where it disagrees)
| Study | Measures | Main finding | Type |
|---|---|---|---|
| Eloundou et al. (OpenAI/UPenn), Science 2024 | Theoretical LLM task exposure | ~80% of US workers could have 10%+ of tasks affected; ~19% could see 50%+ | Exposure (prediction) |
| Felten, Raj & Seamans (AIOE) | Overlap of AI applications with occupational abilities | Ranks occupations very similarly to Eloundou (rank correlation 0.86 in our data) | Exposure (prediction) |
| Microsoft Research (Tomlinson et al., 2025) | AI applicability from 200k Bing Copilot conversations | Information work is where AI is most used; computer & math, sales and admin support score highest | Usage-based exposure |
| Anthropic Economic Index (Mar 2026) | Observed, automation-weighted usage | Programmers 75% coverage; no unemployment rise; 14% drop in job-finding for ages 22-25 | Usage + outcomes |
| Brynjolfsson, Chandar & Chen (Stanford, rev. Aug 2026) | ADP payroll employment | Ages 22-25 in exposed jobs 19% below trend; no economy-wide displacement | Outcomes (early) |
| Yale Budget Lab (Oct 2026) | CPS occupational mix | No clear AI-related labor footprint yet | Outcomes |
| IMF WP/26/220 (Oct 2026) | 700M job postings, 110 economies | Postings ~10% lower in exposed occupations; effect stabilized | Outcomes (postings) |
| ILO (May 2025) | Global task exposure | 25% of global jobs exposed (34% in high-income countries); transformation more likely than replacement | Exposure |
| Goldman Sachs | Displacement scenario | 6-7% of US workers displaced over ~10-year adoption (range 3-14%) | Forecast |
| IMF SDN (Jan 2024) | Global exposure | Almost 40% of global employment exposed; about 60% in advanced economies; roughly half of exposed jobs may benefit | Exposure |
Appendix A
Methodology
- Employment and wages: BLS Occupational Employment and Wage Statistics (OEWS), May 2025 national file, 830 detailed occupations (2018 SOC). Where the median wage is top-coded, the mean is used.
- Exposure measures (four, all published and public):
- Eloundou et al. human-rated β (share of task time an LLM could speed up by 50%+; direct = 1, with tools = 0.5), O*NET-SOC averaged to 6-digit SOC.
- Microsoft Research AI applicability score (Tomlinson et al. 2025; from Bing Copilot conversations).
- Felten-Raj-Seamans AI Occupational Exposure (AIOE), Appendix A.
- Anthropic "observed exposure" (Massenkoff & McCrory, Mar 2026): theoretically feasible tasks seen in real, work-related Claude usage; automated use weighted fully, augmentative use half.
- AI Exposure Index: each measure converted to an employment-weighted percentile (0-100); the index is the mean of available percentiles (occupations need 2+ measures). 772 occupations / 144.0M workers scored (92.6% of OEWS employment). Measures agree strongly (Spearman 0.58-0.86).
- Quintiles: occupations sorted by index into five groups of roughly equal employment (~29M each).
- Zones (replacement vs augmentation): for top-quintile occupations, BLS Employment Projections 2025-35: "substitution zone" = projected decline; "augmentation zone" = growth at or above the all-occupation average (+3.5%); "slow-growth zone" = in between.
- Industries: OEWS May 2025 industry staffing patterns (3-digit NAICS, aggregated to 2-digit sectors); sector index = employment-weighted average of its occupations' index.
- Outcomes: OEWS May 2021 vs May 2025 employment by occupation; BLS CES payrolls (seasonally adjusted) Nov 2022 vs Oct 2026; Census BTOS AI-use and AI headcount questions; CPS 2025 annual averages Table 11 for women's share (exact title matches only).
- JobsListAI data: read-only query of our job database (300 active curated AI-company listings): 87% are engineering or research roles, average salary midpoint about $253k for engineering. This is a curated AI-industry sample, not a labor-market measure, so it is not used in the ranking.
Appendix B
Limitations
- Exposure is not destiny. All four measures estimate where AI can or does touch tasks. None says whether employers will cut jobs, hire fewer people, or grow because workers become more productive.
- Measures date quickly. Eloundou scores reflect early-2023 capabilities; Anthropic usage reflects one provider's traffic in Aug and Nov 2025.
- BLS projections are judgment-based and have historically added limited predictive value beyond trend extrapolation (Anthropic, citing Massenkoff 2025).
- OEWS is not a time series. Comparing May 2021 to May 2025 is indicative only; methodology and sample changes can move estimates.
- Confounders: interest rates, the post-pandemic tech correction, offshoring and the business cycle all affect the same white-collar sectors. Sector correlations are not causal.
- Self-employed and farm workers are largely outside OEWS.
- Demographic matching covers 73% of OEWS employment via exact title matches.
- Census BTOS wording: the current questionnaire refers to "Super Intelligence or SI (formerly referred to as Artificial Intelligence or AI)"; the headcount and hiring questions appear only in the latest cycle.
References
Sources
- BLS OEWS May 2025 national and industry files: https://www.bls.gov/oes/tables.htm (downloads: https://www.bls.gov/oes/special-requests/oesm25nat.zip, https://www.bls.gov/oes/special-requests/oesm25in4.zip)
- BLS Employment Projections 2025-35, occupation tables incl. Table 1.12 factors: https://www.bls.gov/emp/tables.htm (file: https://www.bls.gov/emp/ind-occ-matrix/occupation.xlsx)
- BLS CES via API: https://api.bls.gov/publicAPI/v1/timeseries/data/
- BLS CPS Table 11 (2025): https://www.bls.gov/cps/cpsaat11.htm
- Census BTOS: https://www.census.gov/hfp/btos/data_downloads; Census story (May 2026): https://www.census.gov/library/stories/2026/05/ai-use-businesses.html
- Eloundou et al., GPTs are GPTs: https://arxiv.org/abs/2303.10130; data: https://github.com/openai/GPTs-are-GPTs
- Microsoft Research, Working with AI: https://arxiv.org/abs/2507.07935; data: https://github.com/microsoft/working-with-ai
- Felten, Raj & Seamans AIOE data: https://github.com/AIOE-Data/AIOE
- Anthropic, Labor market impacts of AI (Mar 5, 2026): https://www.anthropic.com/research/labor-market-impacts; data: https://huggingface.co/datasets/Anthropic/EconomicIndex
- Brynjolfsson, Chandar & Chen, Canaries in the Coal Mine (rev. Aug 12, 2026): https://digitaleconomy.stanford.edu/publications/canaries-in-the-coal-mine/
- Yale Budget Lab, Tracking the Impact of AI on the Labor Market (Oct 14, 2026): https://budgetlab.yale.edu/research/tracking-impact-ai-labor-market
- IMF WP/26/220, How is Labor Demand Changing as AI Improves?: https://doi.org/10.5089/9798229061551.001
- IMF SDN 2024/001, Gen-AI and the Future of Work: https://www.imf.org/-/media/files/publications/sdn/2024/english/sdnea2024001.pdf
- ILO, Generative AI and Jobs: 2025 update: https://www.ilo.org/publications/generative-ai-and-jobs-2025-update
- Goldman Sachs, How Will AI Affect the Global Workforce?: https://www.goldmansachs.com/insights/articles/how-will-ai-affect-the-global-workforce